Linear Graphs
Equations of Straight Lines (y = mx + c)
Drawing Straight Line Graphs
Parallel Lines
Perpendicular Lines
Equations of Straight Lines (y = mx + c)
Finding equations of straight lines
What is the equation of a straight line?
- The general equation of a straight line is y = mx + cwhere
- m is the gradient
- c is they-intercept
- The value where it cuts the y-axis
- y = 5x + 2 is a straight line with
- gradient 5
- y-intercept 2
- y = 3 – 4x is a straight line with
- gradient -4
- y-intercept 3
How to find the equation of a straight line from a graph?
- Find the gradient by drawing a triangle and using: Gradient = rise/run
- It is positive for uphill lines and negative for downhill
- Read off the y-intercept from the graph
- Where it cuts the y-axis
- Substitute these values into y = mx + c
What if no y-intercept is shown?
- If you can’t read off the y-intercept
- find any point on the line
- substitute it into the equation
- solve to find c
- For example, a line with gradient 6 passes through (2, 15)
- The y-intercept is unknown
- Write y = 6x + c
- Substitute in x = 2 and y = 15
- 15 = 6 × 2 + c
- 15 = 12 + c
- Solve for c
- c = 3
- The equation is y = 6x + 3
- The y-intercept is unknown
What are the equations of horizontal and vertical lines?
- A horizontal line has the equation y = c
- c is the y-intercept
- A vertical line has the equation x = k
- k is the x-intercept
- For example
- y = 4
- x = -2
Examples
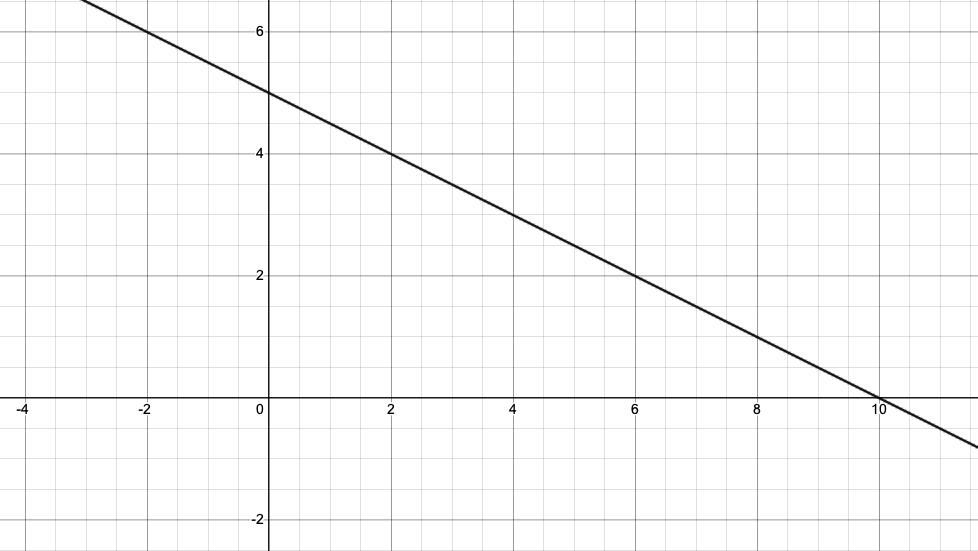
(a) Find the equation of the straight line shown in the diagram below.
Find m, the gradient
Identify any two points the line passes through and work out the rise and run
Line passes through (2, 4) and (10, 0)
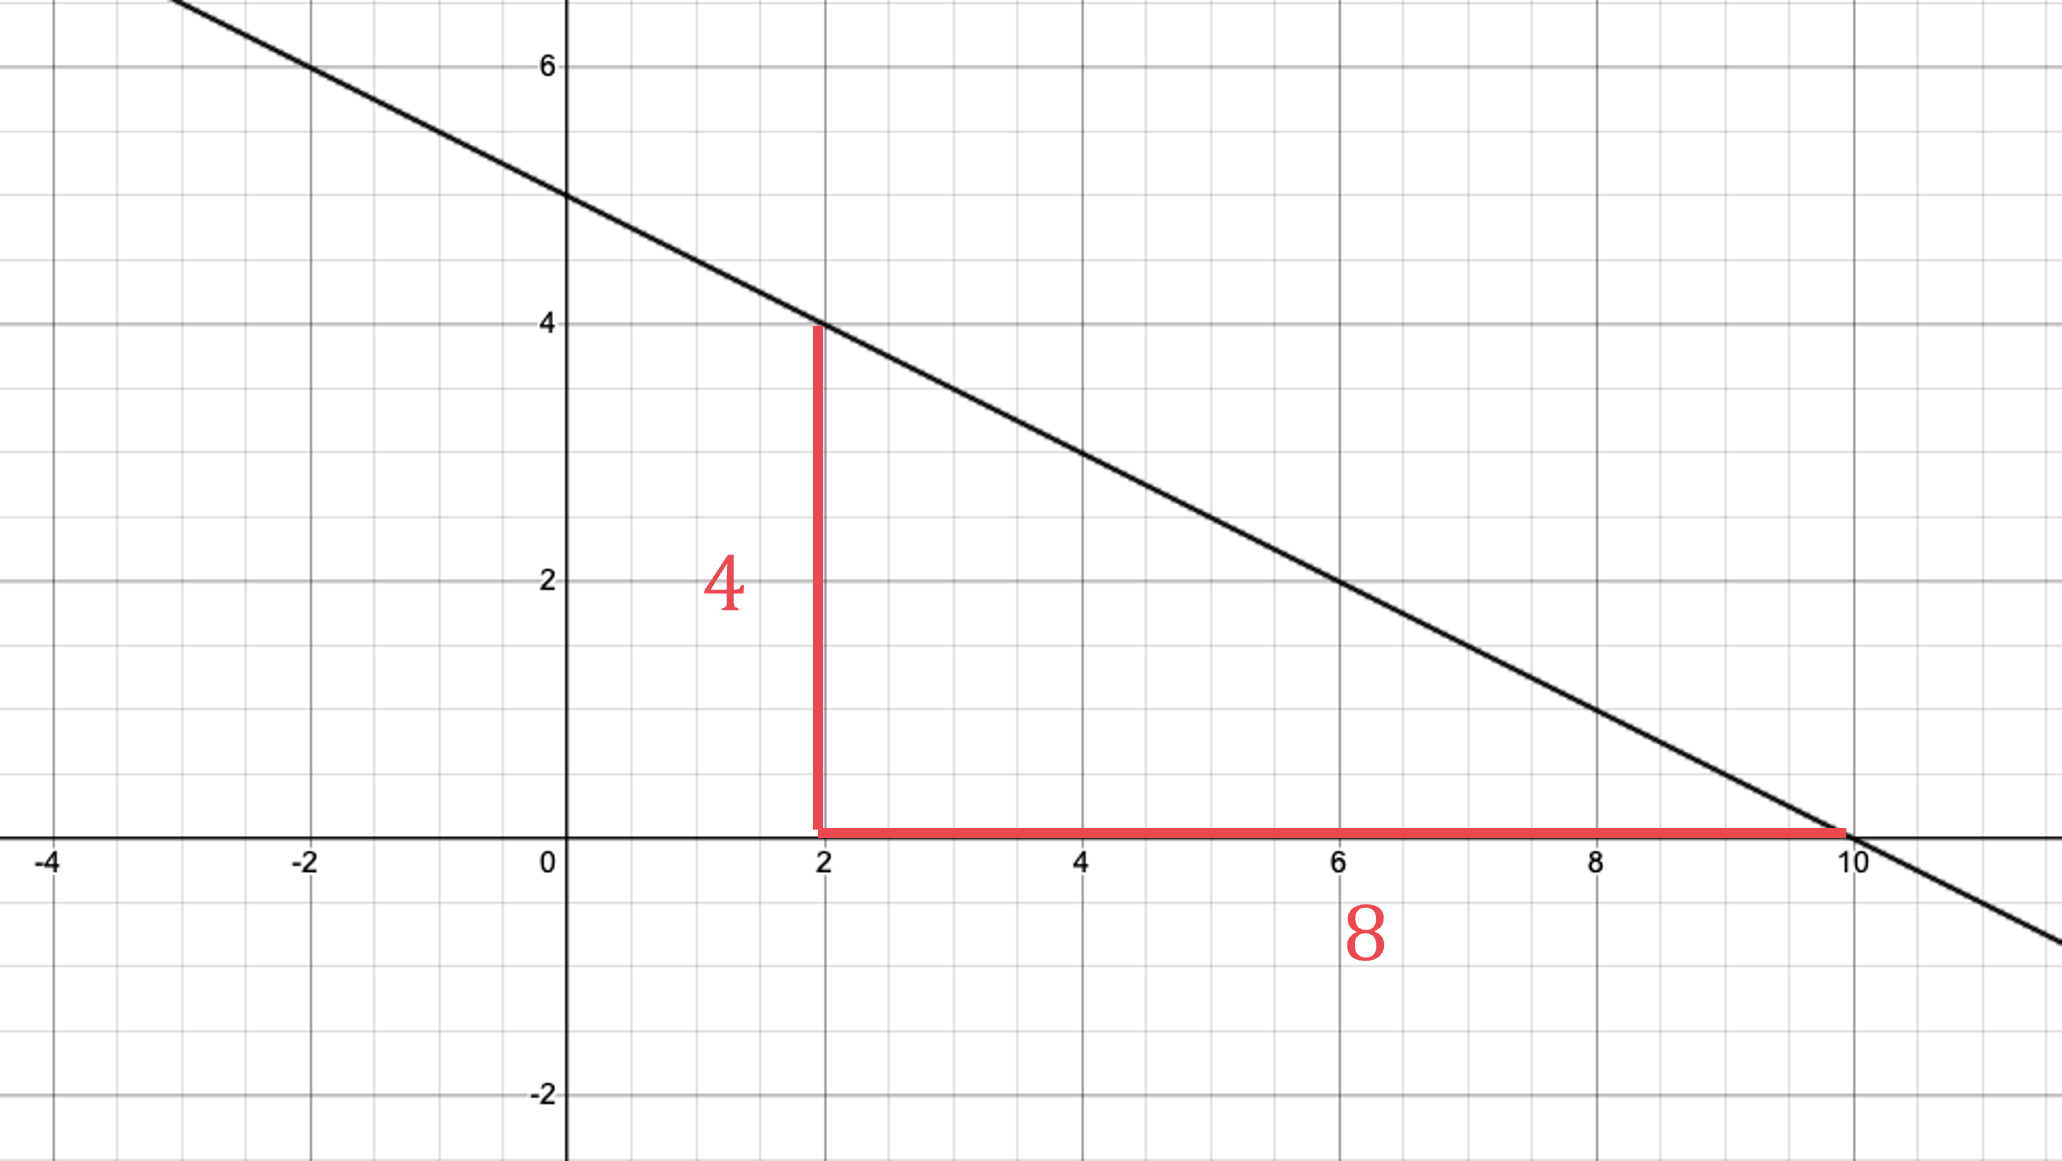
The rise is 4 and the run is 8. Calculate the fraction rise/run = 4/8 = 1/2
The slope is downward (downhill), so it is a negative gradient
gradient, m = – 1/2
Now find the y-intercept
The line cuts the y-axis at 5
y-intercept, c = 5
Substitute the gradient, m, and the y-intercept, c, into y = mx + c
y = -1/2 x + 5
(b) Find the equation of the straight line with a gradient of 3 that passes through the point (5, 4).
Substitute m = 3 into y = mx + c
Leave c as an unknown letter
y = 3x + c
Substitute x = 5 and y = 4 into the equation
Solve the equation to find c
4 = 3 x 5 + c
4 = 15 + c
-11 = c
You now know c
Replace c with −11 to complete the equation of the line
y = 3x − 11
Drawing linear graphs
How to draw a straight line from a table of values?
- You may be given a table of values with no equation
- Use the x and y values to form a point with coordinates (x, y)
- Then plot these points
- Use a ruler to draw a straight line through them
- All points should lie on the line
- For example
- The points below are (-3, 0), (-2, 2), … etc
| -3 | -2 | -1 | 0 | 1 | 2 | 3 | |
| 0 | 2 | 4 | 6 | 8 | 10 | 12 |
How do I draw a straight line using y = mx + c?
- Use the equation to create your own table of values
- Choose points that are spread out across the axes given
- For example, plot y = 2x + 1 on axes from x = 0 to x = 10
- Substitute in x = 0, x = 5 and x = 10 to get y coordinates
- Then plot those points
- Substitute in x = 0, x = 5 and x = 10 to get y coordinates
| 0 | 5 | 10 | |
| 1 | 11 | 21 |
How do I draw a straight line without using a table of values?
- Assuming the equation is in the form y = mx + c
- Start at the y-intercept, c
- Then, for every 1 unit to the right, go up m units
- m is the gradient
- If m is negative, go down
- If m is a fraction, remember that gradient is change in y divided by change in x
- A gradient of
would be
units up for every
units right
- A gradient of
- This creates a sequence of points which you can then join up
- Be careful of counting squaresif axes have different scales
- 1 unit might not be 1 square
- Be careful of counting squaresif axes have different scales
What if the equation is not in the form y = mx + c?
- Equations will not always be presented in the form y = mx + c
- Rearranging to y = mx + c will make plotting these graphs easier
- Consider the equation
- Subtract 3x from both sides
- Divide both sides by 5
- It can now be seen that the gradient is
and the y-intercept is 6
- Subtract 3x from both sides
- Make sure you only have 1 y on one side, rather than say, 5y
How can I plot equations in the form ax + by = c?
- Instead of rearranging, equations in the form ax + by = c, like the example above, can also be plotted by considering the x and y intercepts instead
- Substitute in x = 0 to find the y-intercept
- Substitute in y = 0 to find the x-intercept
- E.g. for
- When
,
, so
- When
,
, so
- When
- The points (0, 6) and (10, 0) can then be plotted and joined with a straight line
Remember
- Always plot at least 3 points (just in case one of your end points is wrong!)
Examples
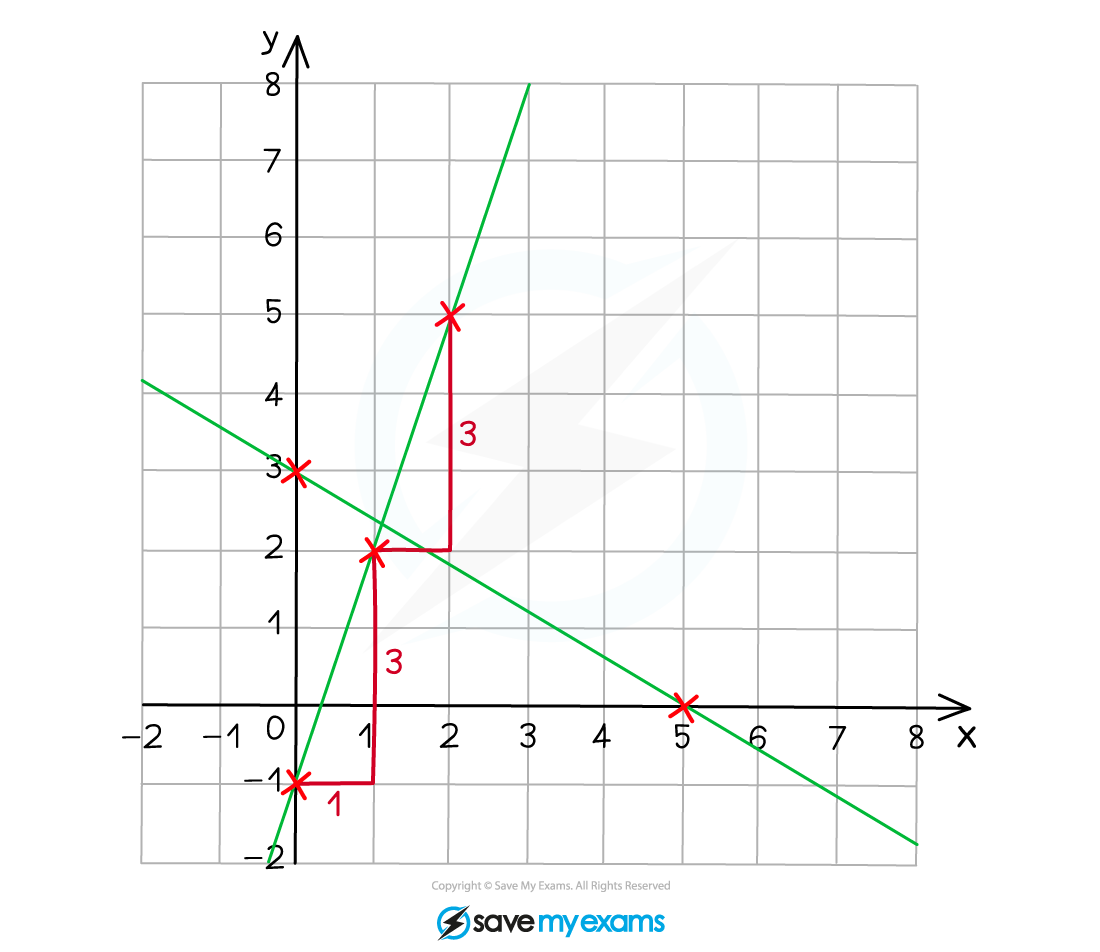
On the same set of axes, draw the graphs of and
.
Rearrange into the form
to make it easier to plot
For , create a table of values
| 0 | 1 | 2 | |
| -1 | 2 | 5 |
Plot the points (0, -1), (1, 2) and (2, 5)
Connect with a straight line
Alternatively, start at the y-intercept (0, -1) and mark the next points 3 units up for every 1 unit to the right
For , create a table of values
Because of the fraction, x = 5 is a good point to include
| 0 | 3 | 5 | |
| 3 | 1.2 | 0 |
Plot the points (0, 3), (3, 1.2) and (5, 0)
Connect with a straight line
Alternatively, start at the y-intercept (0, 3) and mark the next points 3 units down for every 5 units to the right
Leave a Reply