Periodic function graph
Sine and Cosine graphs appear fairly frequently on the ACT math section. It is less likely that you’ll be asked to calculate specific values on the graphs (though this does happen occasionally).
Instead, it’s much more likely you’ll be asked to:
- Look at a graph and identify a possible equation for that graph
- Be given an equation and asked to identify an accurate graph of that equation
Either of these types of questions can be quite easy, as long as a student remembers some key facts about the sine and cosine graphs.
Basic Principles
The Sine and Cosine functions are wave functions. They repeat forever making the same pattern. The values for the sine and cosine graphs are the same values that one could find by looking at the unit circle.
Sine and Cosine graphs look almost identical, but they start at slightly different places. The Sine graph starts at the origin (0,0), while the Cosine graph starts at (0,1). Therefore, the two graphs are basically the same, but shifted by
π2in the x-direction from each other.

Amplitude
The Sine and Cosine functions have the same amplitude, which is the distance from the center line (the x-axis for the default graph) to the maximum point of the graph.
- The default amplitude of the Sine and Cosine graphs = 1
Period (Frequency)
The period of a repeating graph like sine and cosine refers to how long the graph needs to go along the x-axis until it begins to repeat. The period of the sine and cosine graphs is also the same.
- The default period of the Sine and Cosine graphs = 2π
Shifts
The Sine and Cosine graphs are affected by x and y shifts just like any other functions. Y shifts will affect the amplitude of the graphs, while x shifts will affect the frequency.
Shifts are accomplished either through the addition of leading coefficients in front of the variables or by adding constant terms next to the variables.
Y-Shifts
Y-Shifts are more intuitive. When a constant is added to the sine or cosine function, it shifts the graph up or down based on the number and sign of the constant.
If the y constant is positive, the graph shifts up, and if the y constant is negative, the graphs shifts down.
The same is true for coefficients in front of cos(x) or sin(x). Coefficients greater than 1 will stretch the graph up/down, while coefficients smaller than 1 will compress the graph.
X-Shifts
Just like with other functions, X-shifts are a bit more counterintuitive. For example, the graph of sin(x + 1) shifts left instead of to the right. Also, sin(4x) compresses the graph by a factor of 4, rather than expanding it by that amount.
The easiest way to think about this is that by affecting the x value, the amount of work being asked of the x variable is changing. If each x variable is multiplied by 4, then that means that it only takes a number ¼ as big to get the same output, and so everything compresses to account for that.
Similarly, with (x + 1), the number -1 will produce the same output that x = 0 used to create, and so the graph has to shift one unit to the left to account for this.
In summary:
- Sine and cosine are repeating wave functions when graphed. They have an amplitude of 1 and a period of 2
- Y-constants and coefficients in front of sin/cos will stretch or move the graph proportionally with these added terms
- Constants and coefficients inside of the sin and cos with the x variable will stretch or move the graph in the inverse direction of that coefficient/constants sign or magnitude
Sample Problems
This can be one of the trickier concepts at first, but with a little practice these questions can become quick and easy. Here are two sample problems to give some practice:

The question does not identify which of the two graphs is sine or cosine, but since the dotted line graph starts at the origin and the solid line graph starts above the origin, it’s clear the solid line is the cosine graph and the dotted line is the sine graph.
The sine graph has a higher amplitude than the cosine graph, which means that its coefficient must be larger than that of the cosine graph (a1 > a2). Since the sin graph has been stretched out, it’s also clear that a1 > 0. As a result, the answer must be B.
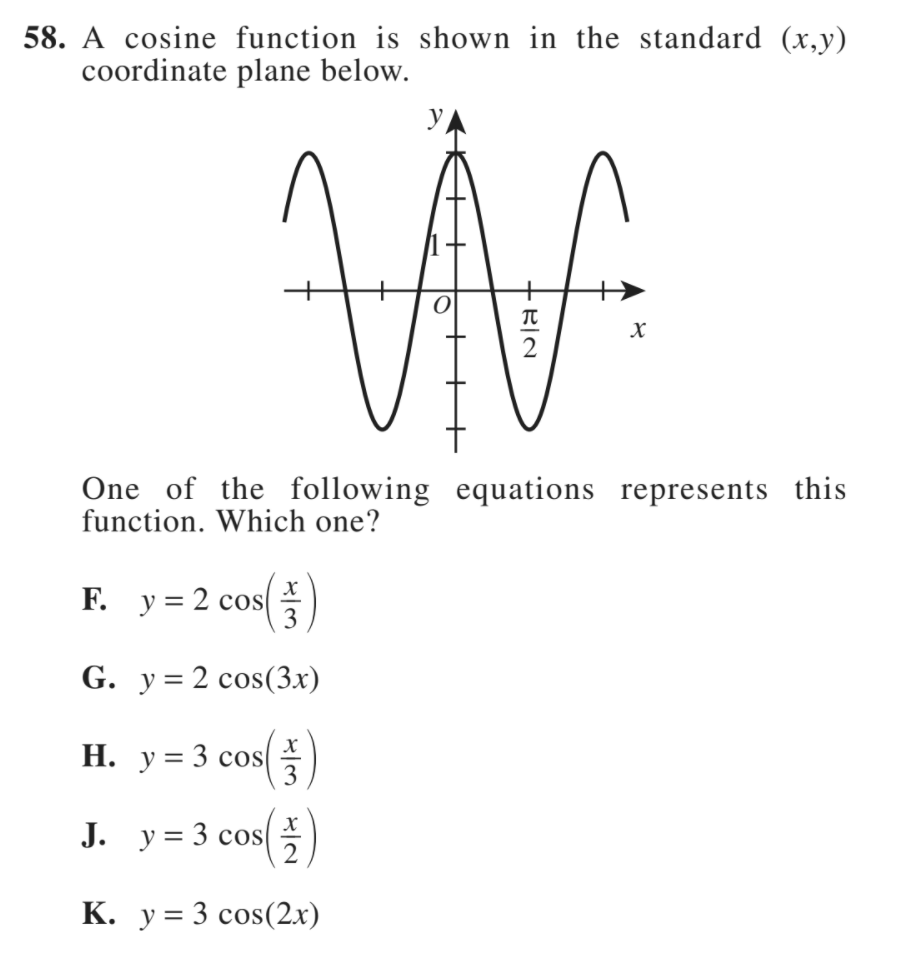
This question is a more direct example of quantitative shifts. The Cosine function normally starts at (0,1), but in this graph that is now (0,3), meaning that the equation has been stretched out by a factor of 3. This eliminates answers F and G.
Looking next at the period, the graph appears to repeat after x = π . This means that the graph has been compressed along the x-axis, which means the x value is multiplied by a coefficient greater than 1. Only K does both things correctly and so this is the answer.
Leave a Reply